The “Baltic Tiger” comes on digital paws

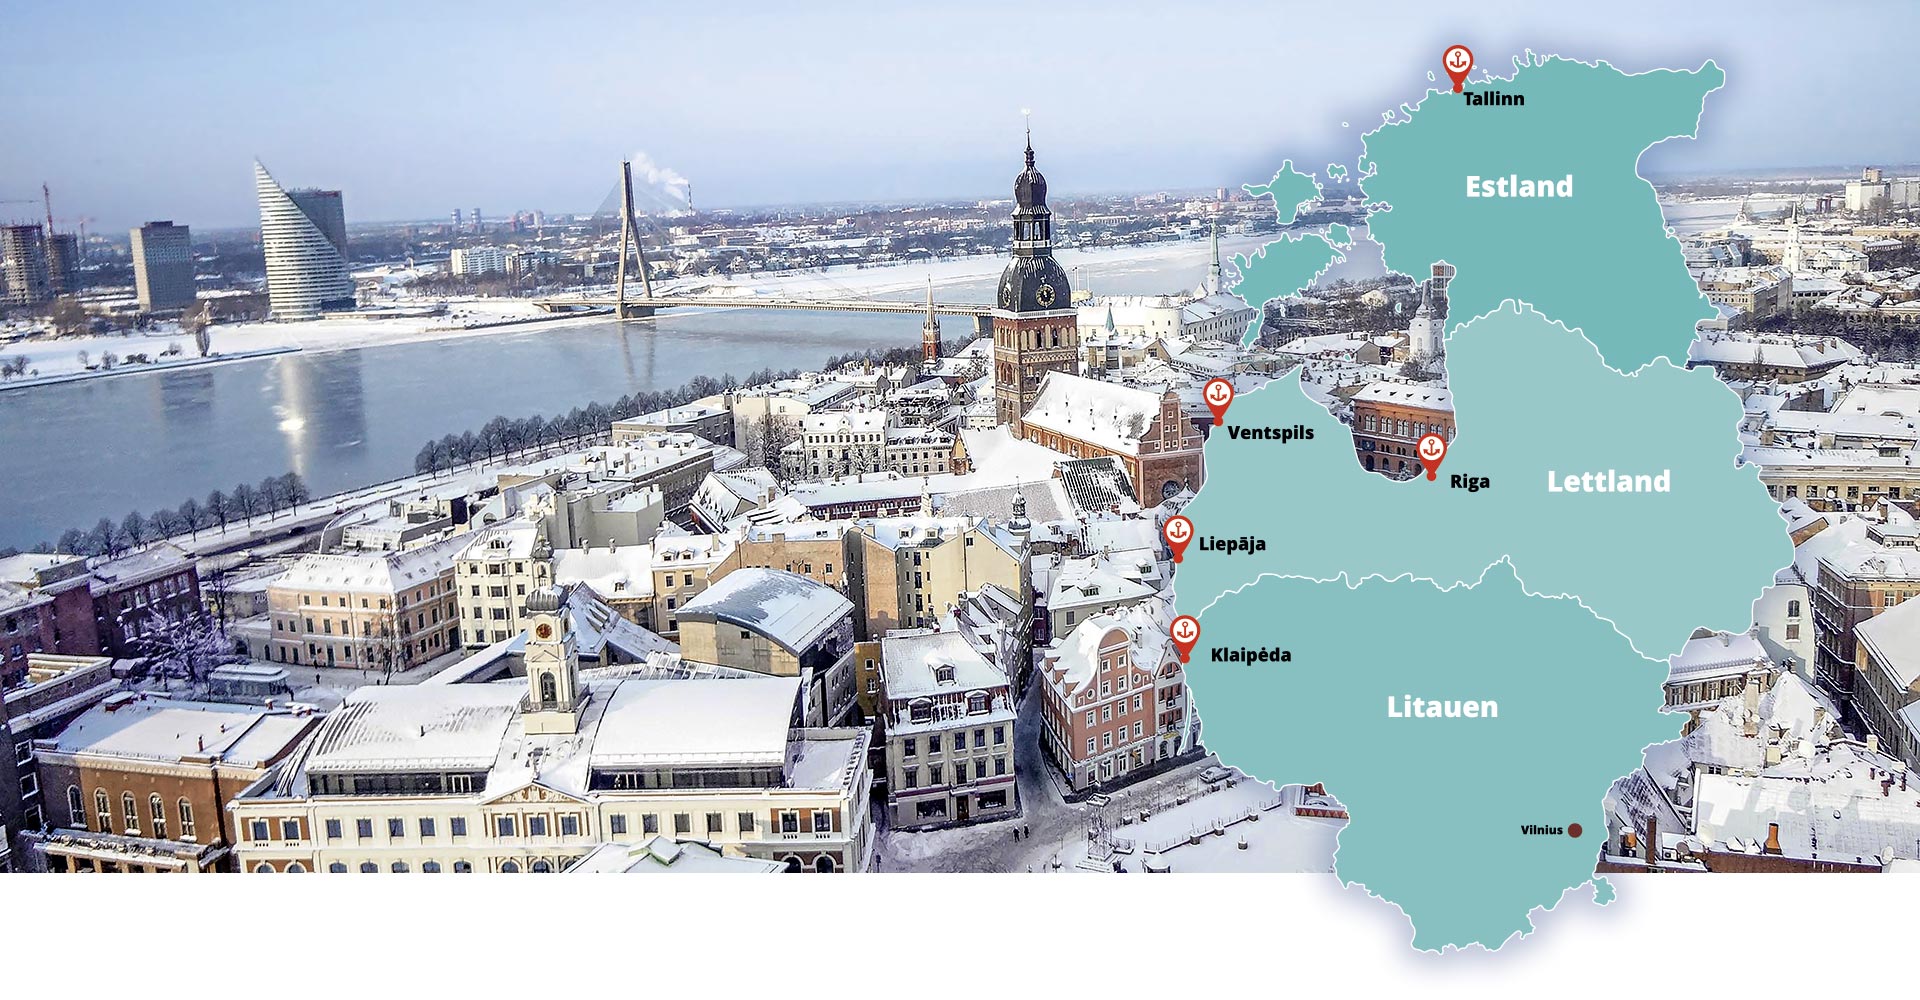
When the Baltic States joined the European Union on May 1 2004, they were often referred to as the “Baltic Tiger” because of the high pace at which reform took place in them and their rapid economic growth in the 1990s.
Although the speed of these processes has slowed down considerably in Estonia, Latvia and Lithuania in recent years due to them adapting to the western industrialised countries, the tiger is still ready to pounce – and especially on digital paws.
Germany is one of the Baltic states’ most important trading partners and ranks either first (Estonia) or second (Latvia and Lithuania) among their main suppliers. In terms of main consumer countries, the Federal Republic of Germany is still in 4th and 6th place. The situation is different the other way round: The Baltic states rank in the 40s to 60s (see below) among Germany’s more than 230 trading partners.
Economic relationship
Foreign trading partner ranking for foreign trade for the Federal Republic of Germany
Exports 2019
(in €1,000)
1. United States 118,680,140
2. France 106,563,521
3. People’s Republic of China 95,983,949
…
48. Lithuania 3,461,608
56. Estonia 1,824,976
57. Latvia 1,725,128
Imports 2019
(in €1,000)
1. People’s Republic of China 110,054,162
2. Netherlands 97,816,180
3. United States 71,334,115
…
51. Lithuania 2,107,591
66. Latvia 871,934
68. Estonia 814,307
Estonia
Capital: Tallinn
Population 2020
Area
GDP/capita 2020 in €
Most important import goods 2019
according to SITC as a % of total imports
- Chemicals 11,4%
- Motor vehicles and parts 9,5%
- Petrochemicals 8,2%
Most important export goods 2019
according to SITC as a % of total exports
- Machinery 9,3%
- Raw materials (except fuels) 8,0%
- Food 7,7%
Main supplier countries 2019
Share in %
- 1. Germany 9,8%
- 2. Russia 9,6%
- 3. Finland 8,6%
Main customer countries 2019
Share in %
- 1. Finland 15,6%
- 2. Sweden 10,0%
- 3. Latvia 8,7%
- 6. Germany 6,0%
Latvia
Capital: Riga
Population 2020
Area
GDP/capita 2020 in €
Most important import goods 2019
according to SITC as a % of total imports
- Chemicals 11,8%
- Food 10,9%
- Electrical engineering 8,4%
Most important export goods 2019
according to SITC as a % of total exports
- Raw materials (except fuels) 14,1%
- Food 13,9%
- Chemicals 9,1%
Main supplier countries 2019
Share in %
- 1. Lithuania 17,6%
- 2. Germany 10,9%
- 3. Poland 9,4%
- 4. Estonia 8,5%
Main customer countries 2019
Share in %
- 1. Lithuania 17,1%
- 2. Estonia 11,7%
- 3. Russia 9,2%
- 4. Germany 7,2%
Lithuania
Capital: Vilnius
Population 2020
Area
GDP/capita 2020 in €
Most important import goods 2019
according to SITC as a % of total imports
- Chemicals 14,9%
- Crude oil 12,3%
- Food 9,3%
Most important export goods 2019
according to SITC as a % of total exports
- Chemicals 15,2%
- Food 13,0%
- Petrochemicals 11,4%
Main supplier countries 2019
Share in %
- 1. Russia 14,5%
- 2. Germany 11,7%
- 2. Poland 11,7%
- 3. Latvia 7,1%
Main customer countries 2019
Share in %
- 1. Russia 14,0%
- 2. Latvia 9,5%
- 3. Poland 7,9%
- 4. Germany 7,6%
Sources: Statistisches Bundesamt (DESTATIS) 2020, Germany Trade & Invest 2020


